Blog
Lithium battery cycle data analysis with curves and equations
23 Oct 2021
Generally, cycle life testing will generate a lot of data, which can obtain a lot of information. What analysis and processing can we do with these cycle data? The following summarizes some of the data processing.

1. Charge and discharge curve
The charge-discharge curve refers to the curve of the battery's voltage, current, capacity, etc. changing over time during the charging and discharging process of the battery. The information contained in the charge and discharge curve is very rich, including capacity, energy, working voltage and voltage platform, the relationship between electrode potential and state of charge, etc.

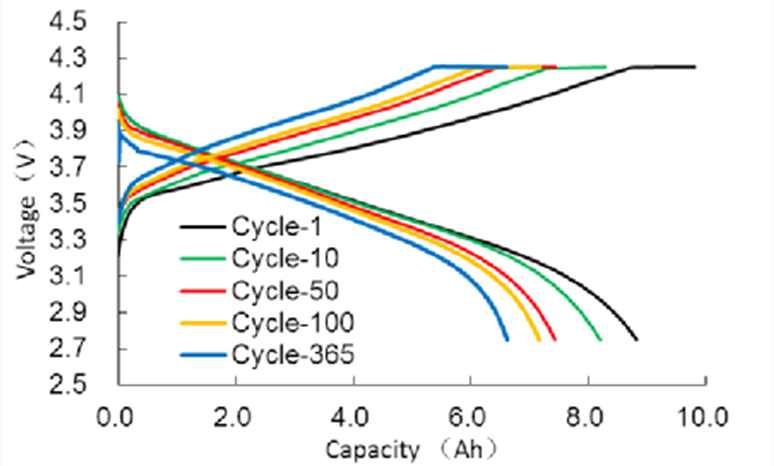
A typical cyclic charge-discharge curve is shown in Figure 1. As the cycle progresses, the battery capacity decreases and the charge-discharge curve will change.


2. Coulomb efficiency of charge and discharge
Coulomb efficiency, also called charging efficiency CE, refers to the ratio of battery discharge capacity to charging capacity during the same cycle, that is, CE=Discharge capacity/Charge capacity*100%. The amount of charge input is often not used to convert the active material into a charged state, but part of it is consumed (for example, an irreversible side reaction occurs), so the Coulomb efficiency is often less than 100%. Coulomb efficiency is an important battery parameter, which is closely related to the loss of active lithium.

The amount of irreversible lithium Qk is:

QK= Qk-1 - qk = QK-1 .CEK

Among them, Qk-1Is the reversible amount of lithium in the previous cycle, CEk Is the Coulomb efficiency of the cycle.

3. dQ/dV curve

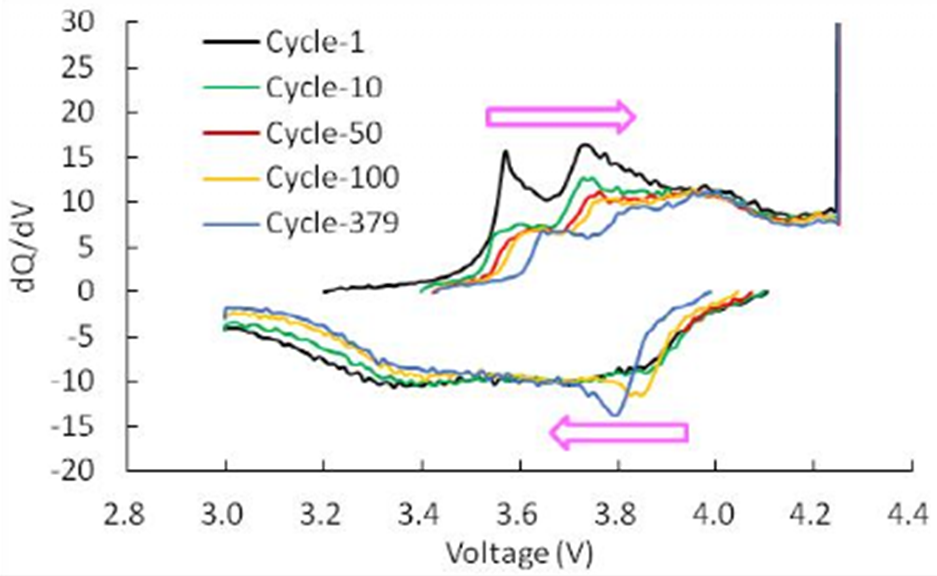
Charge and discharge the lithium-ion battery, and record the charge and discharge parameters, especially the power and voltage data. After obtaining these data, the data will be processed first. We subtract the voltage and power data from the n+1th data point. With n data points of voltage and power data, we get a dV and dQ data. After processing all the data in turn, we get a series of dV and dQ data, and then we divide dQ by dV to get another one Data dQ/dV, then we use dQ/dV as the ordinate and voltage, capacity or SoC as the abscissa, we get a standard dQ/dV curve, as shown in Figure 6.

Figure 6 dQ/dV-voltage curve under different cycles

There are another two methods of analysis and processing life cycle data of Lithium batteries which we will discuss in the following week.

Conclusion:
To ensure the smooth operation of your application, EverExceed research and development engineers works day and night to research and design the state of art Lithium Iron phosphate batteries with the perfect charging and discharging parameters which confirms the longest cycle life available for the battery. So choose EverExceed as your brand for the complete reliability.

Are you looking for more information about EverExceed's  professional products and solutions?  Our expert team is always here to help. Please fill in the form and our sales representative will contact you shortly. EverExceed | Empower, Energize, Exceed the Energy you Expect forever.
copyright © 2024 EverExceed Industrial Co., Ltd.all rights reserved.
leave a message
welcome to everexceed
If you are interested in our products and want to know more details,please leave a message here,we will reply you as soon as we can.

home

products

about

contact